Predicted electrical power, efficiency 0.832.
Back to projects
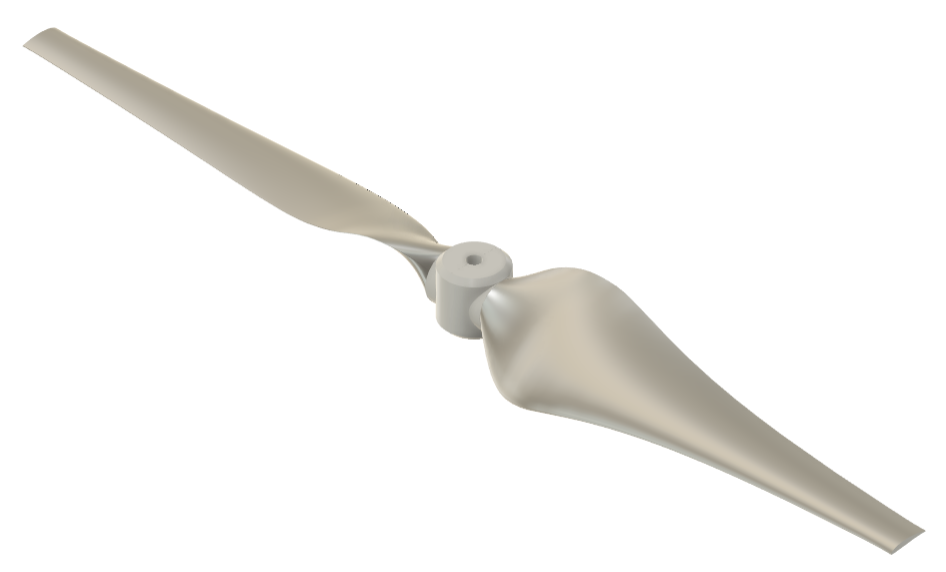
Small-Scale Wind Turbine
This project developed a two-bladed small-scale horizontal-axis wind turbine through a complete workflow: airfoil screening, BEM blade optimization, QBlade simulation, PMSG matching, prototype manufacturing, generator testing and wind tunnel validation.
01
Initial Airfoil Screening
The initial design phase reduced a broad airfoil database to a focused set of candidates for low-Re operation. Profiles were first filtered from AirfoilTools using a 12–16% thickness-to-chord range and a reference Reynolds number of about 200,000, then ranked through a weighted score based on aerodynamic efficiency, stall behaviour and relative thickness. The four best-ranked profiles were retained for detailed comparison, with NACA 4415 added as a reference case.
Weighted shortlist
| Rank | Airfoil | Eff. score 50% | Stall score 30% | Thick. score 20% | Total |
|---|---|---|---|---|---|
| #1 | FX 63-137 smoothed | 9.84 | 10.00 | 9.40 | 9.80 |
| #2 | EPPLER 397 | 9.89 | 10.00 | 9.00 | 9.74 |
| #3 | EPPLER 396 | 10.00 | 10.00 | 8.20 | 9.64 |
| #4 | MH114 | 9.81 | 10.00 | 8.04 | 9.51 |
| #10 | NACA 4415 | 7.55 | 10.00 | 8.00 | 8.38 |
02
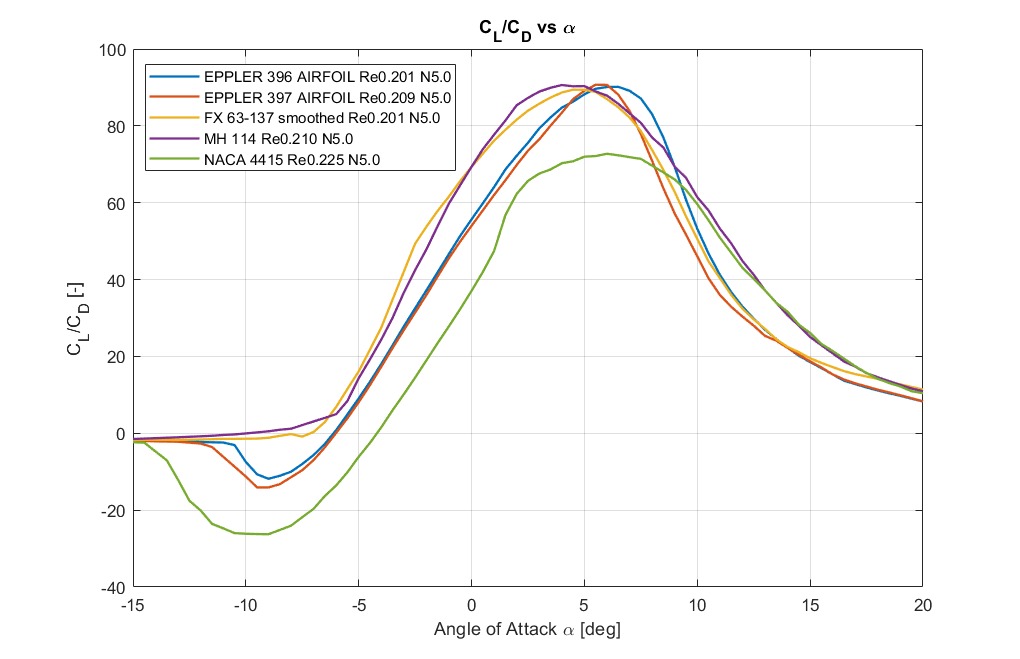
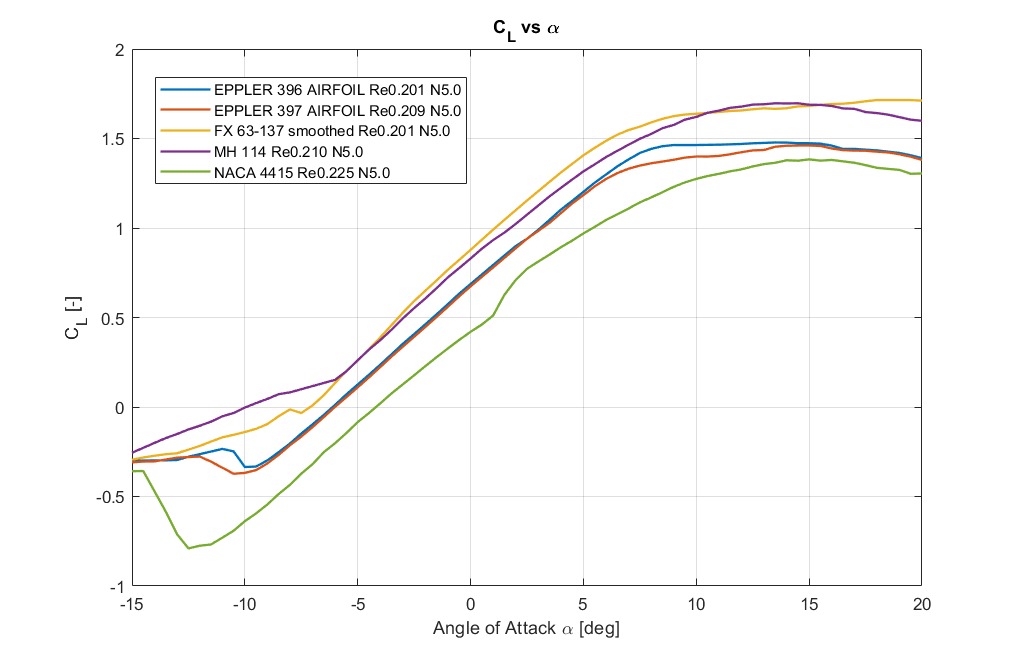
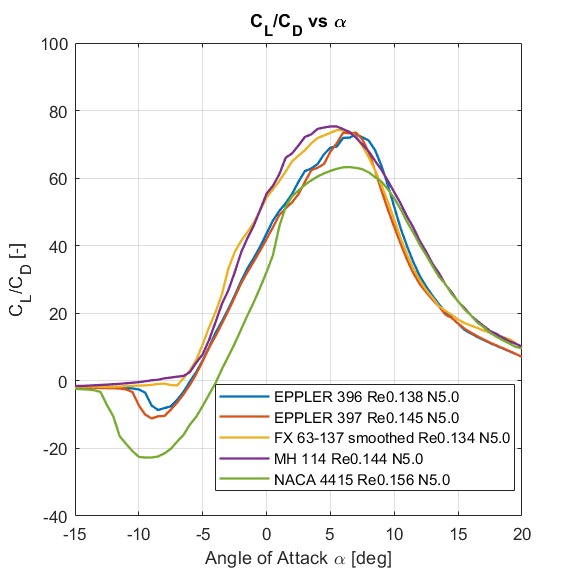
Aerodynamic Comparison
The shortlisted airfoils were compared through polar curves at realistic operating Reynolds numbers. This step checked whether the strongest profiles from the ranking also provided a suitable lift-to-drag ratio, delayed stall behaviour and a stable aerodynamic response before moving into BEM blade optimization.
03
BEM Blade Optimization
Each candidate blade was optimized with Blade Element Momentum theory. The 450 mm radius was divided into 15 radial elements and chord, twist and thickness were recalculated from an initial TSR of 6.5 until the manufacturing limits were satisfied along the span.
- Minimum chord constraint: 40 mm.
- Minimum thickness constraint: 5 mm.
- Final MH114 blade: TSR 4.9, 15 elements plus tip section.
04
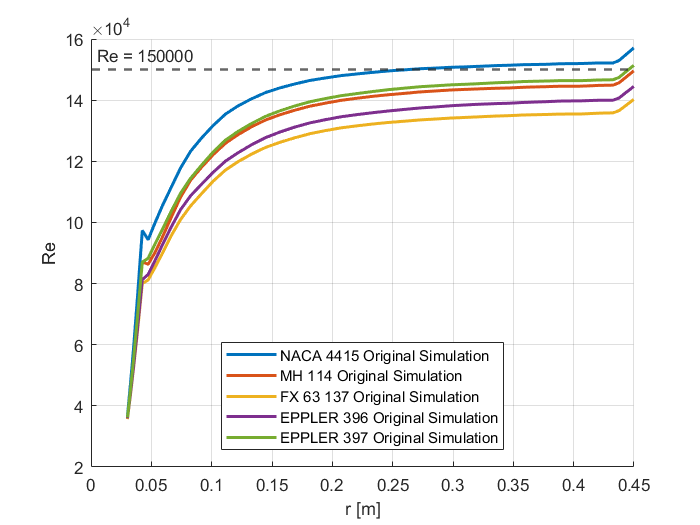
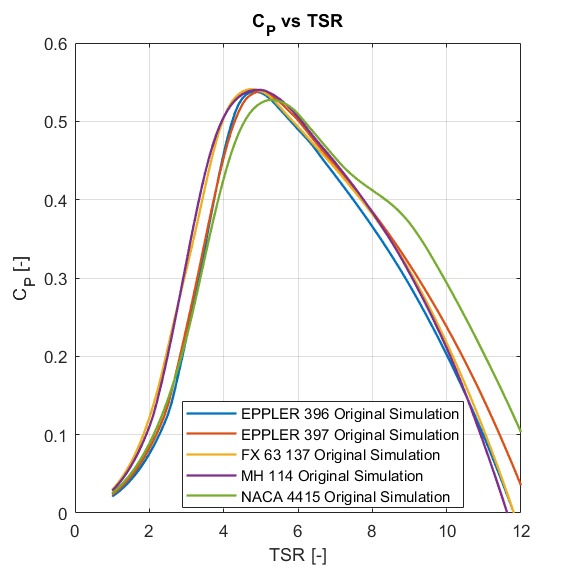
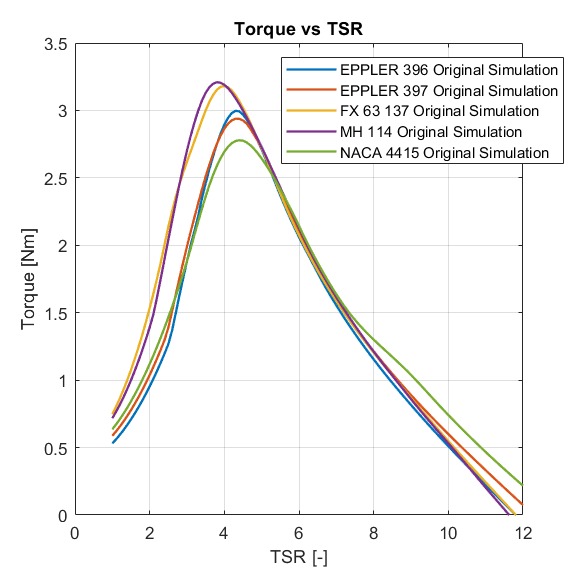
QBlade Evaluation
The optimized blade candidates were first checked against the operating Reynolds range, then compared at the representative design Reynolds number through lift-to-drag curves. Their QBlade performance was then evaluated using power coefficient and torque curves. MH114 was selected for the final turbine because it combined a strong CP curve with the highest torque peak at the operating conditions.
05
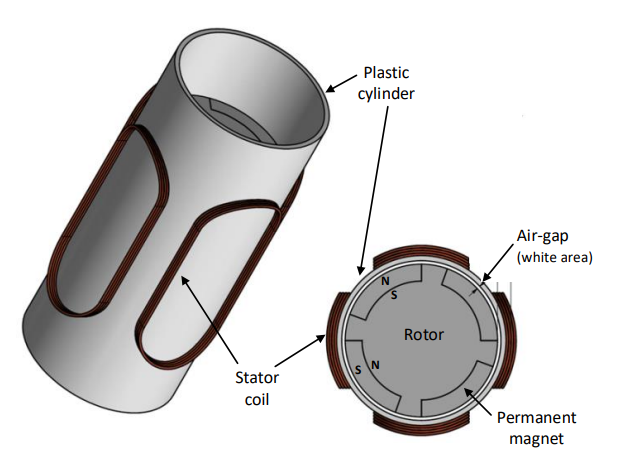
PMSG Matching
The aerodynamic design was coupled with a three-phase permanent magnet synchronous generator. For the best blade profiles, two generator configurations were evaluated: two coils per phase and four coils per phase. The four-coil option predicted higher efficiency, while the two-coil layout was chosen for the physical prototype because it was significantly simpler to build and test.
Simpler physical generator layout, efficiency 0.747.
06
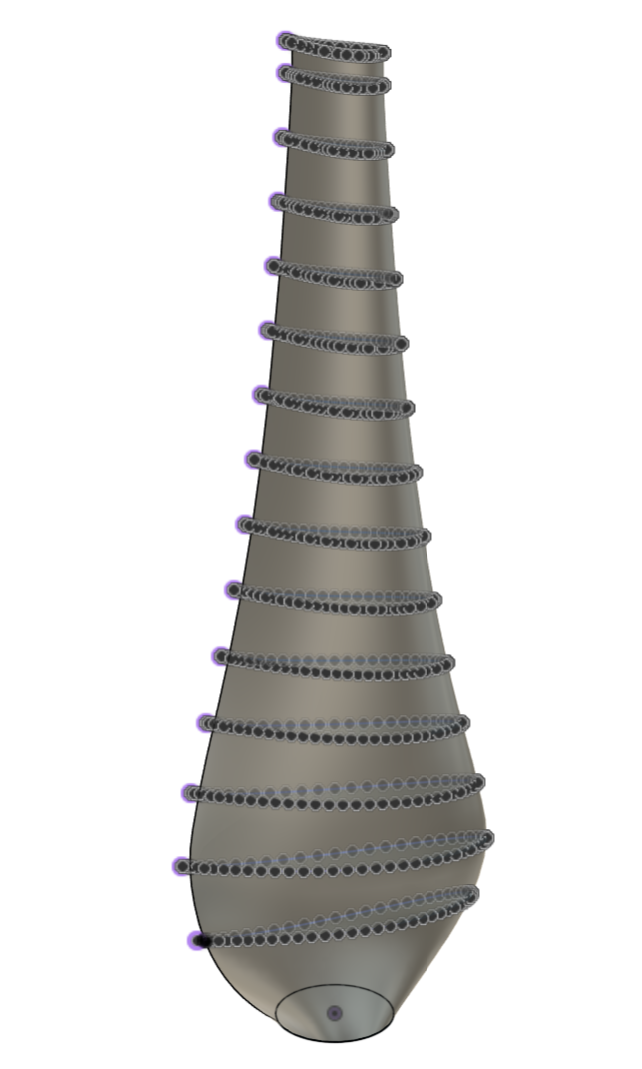
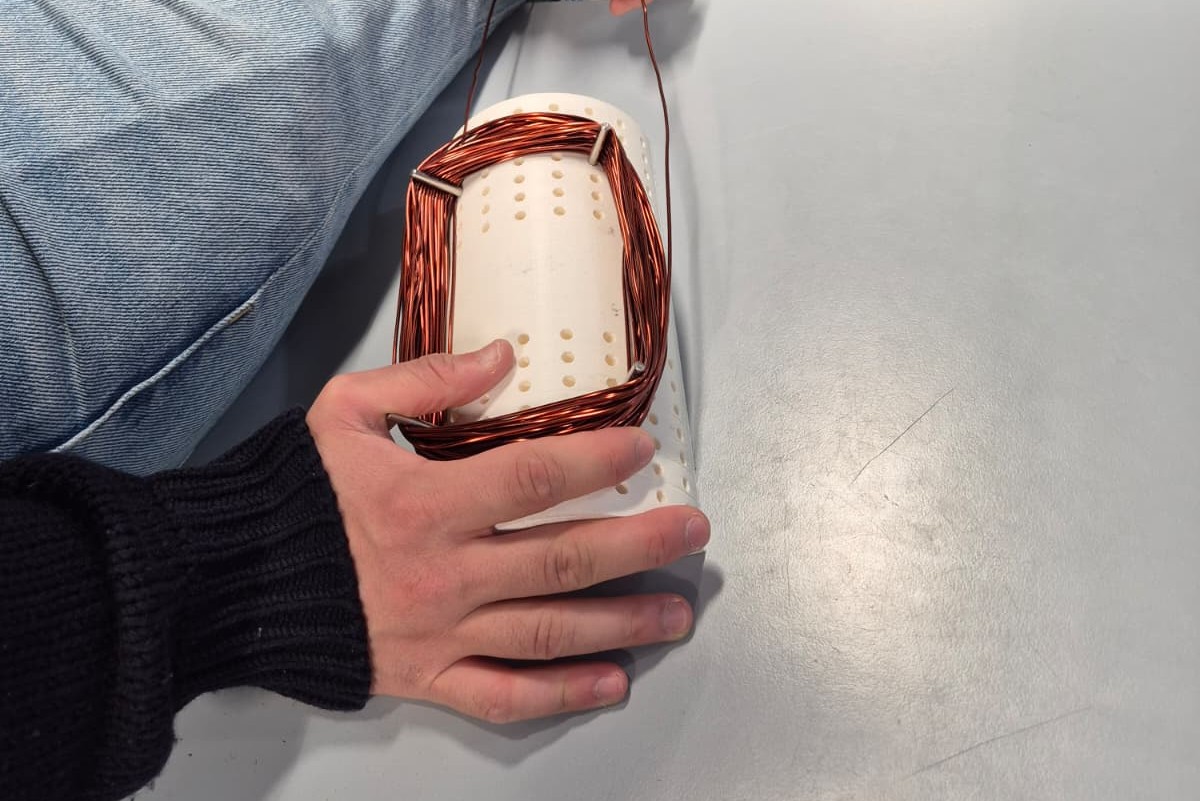
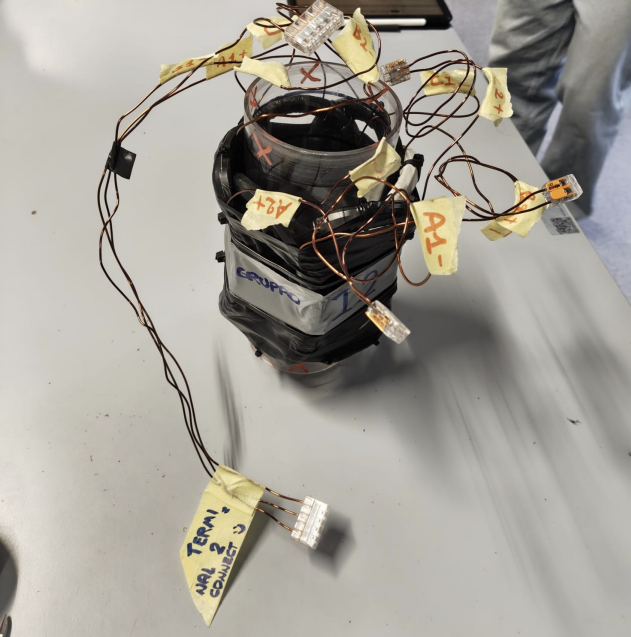
Manufacturing And Assembly
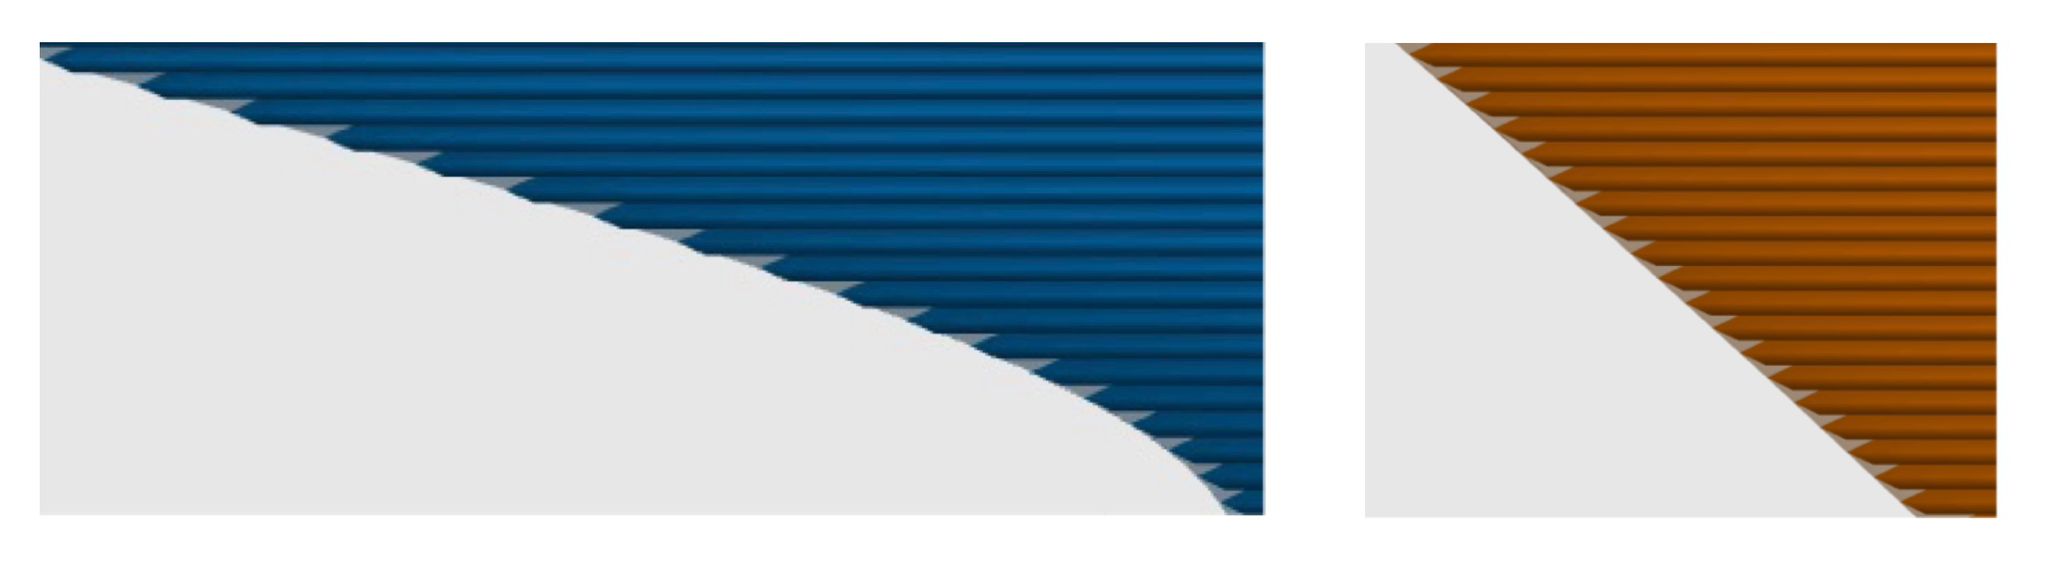
The MH114 blade was modelled in Fusion 360 from the Excel-based section definition and manufactured using FDM additive manufacturing. The generator was then built manually: six coils were wound, arranged in the stator layout and connected in a three-phase star configuration.

07
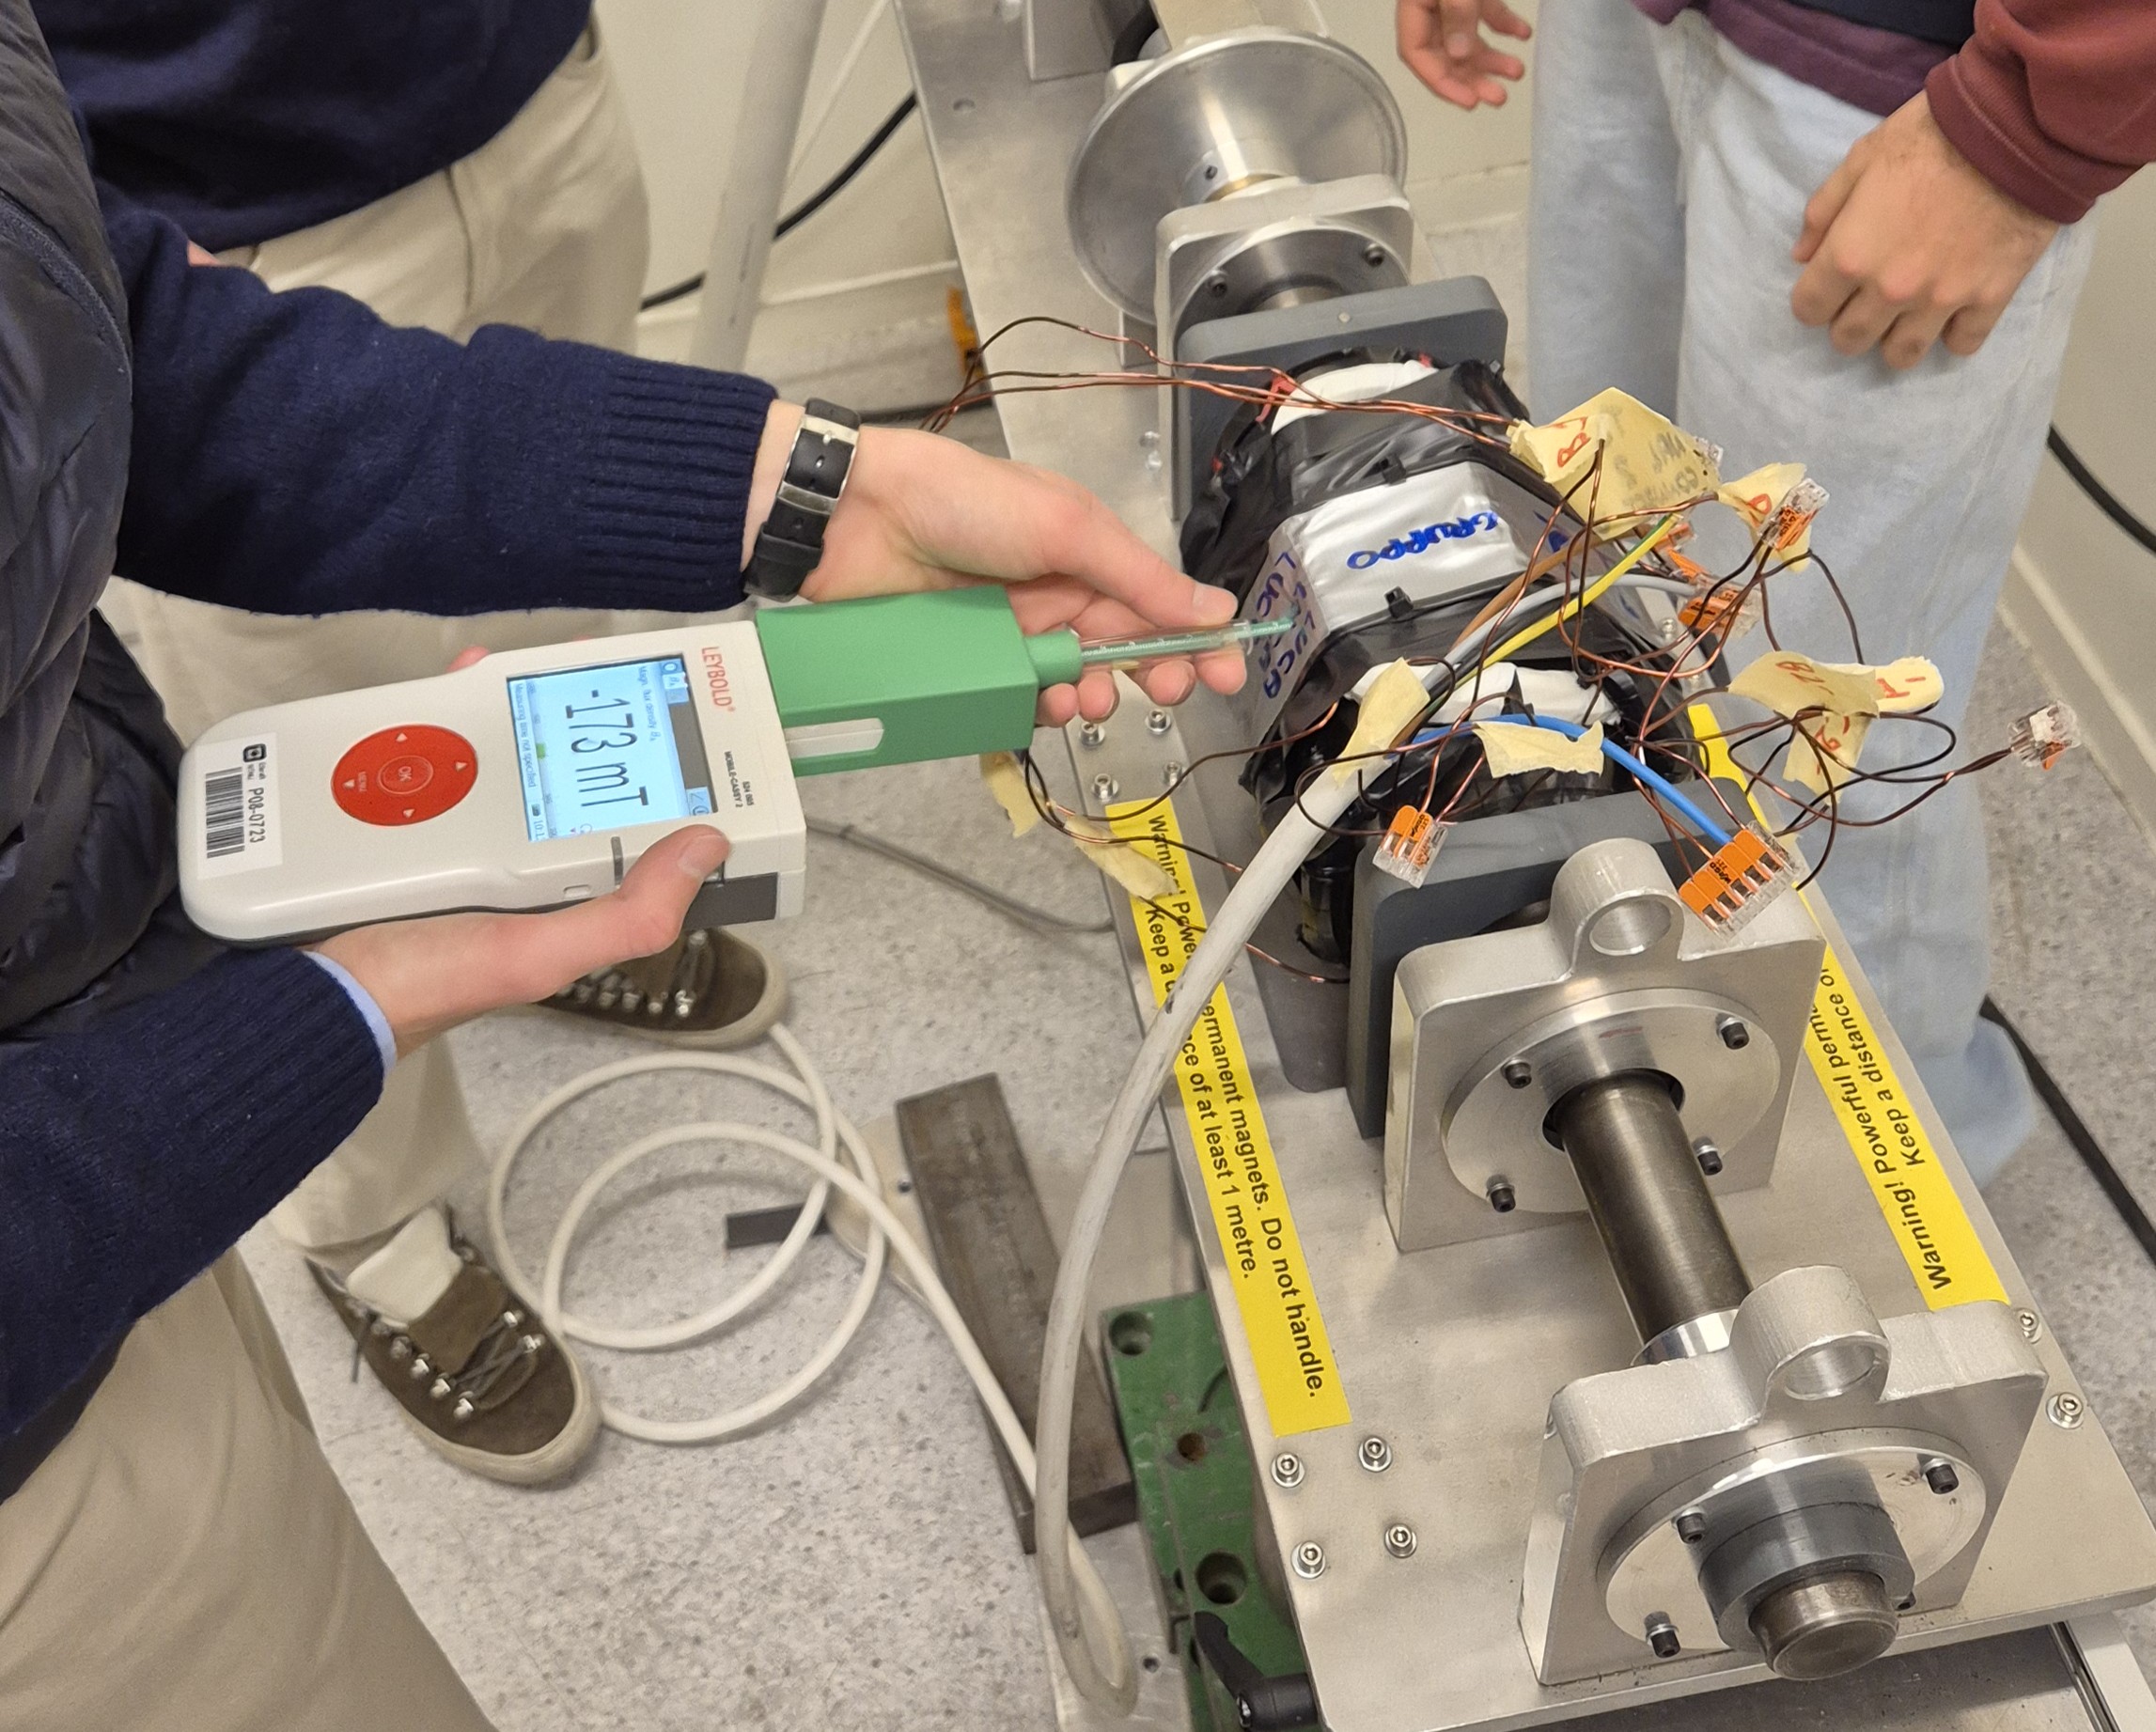
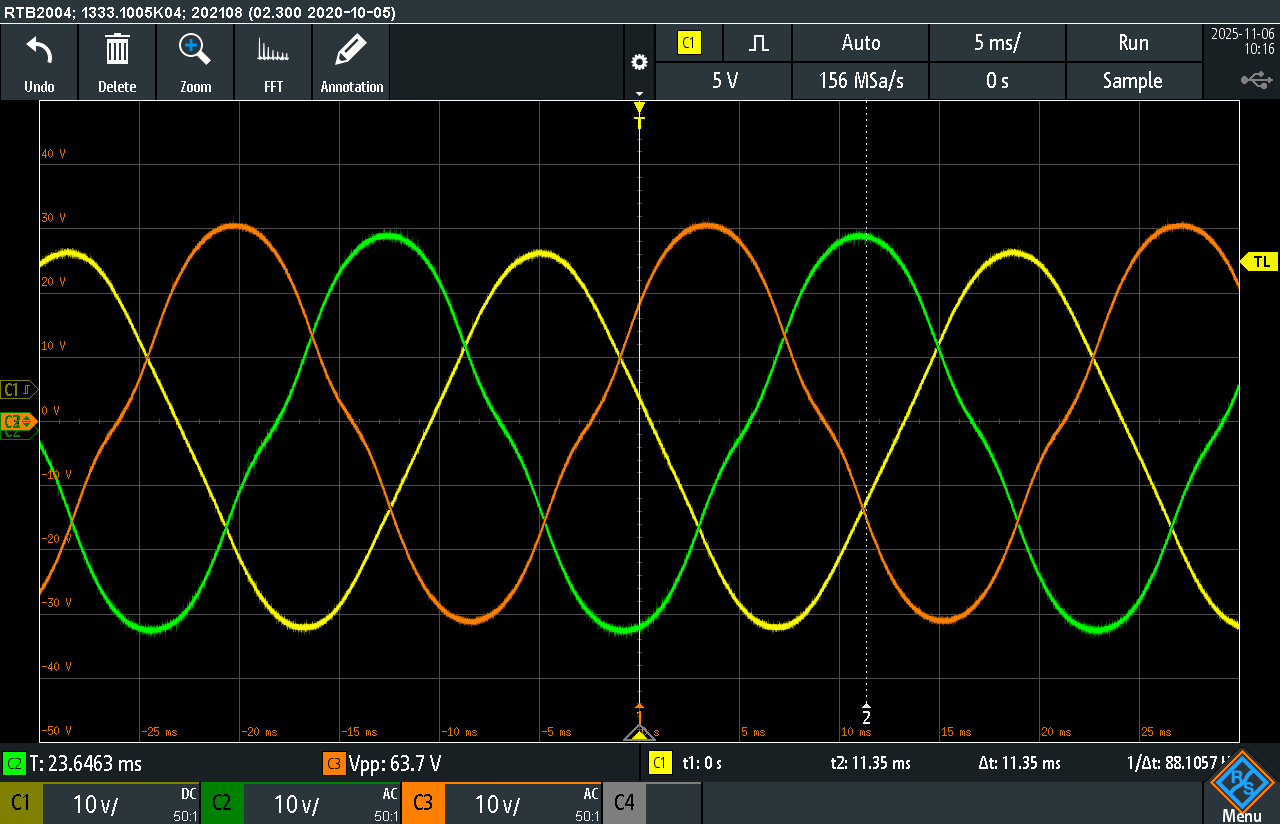
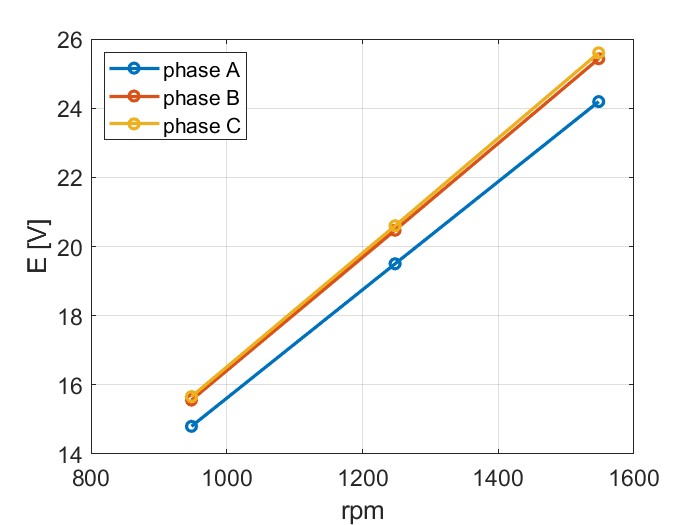
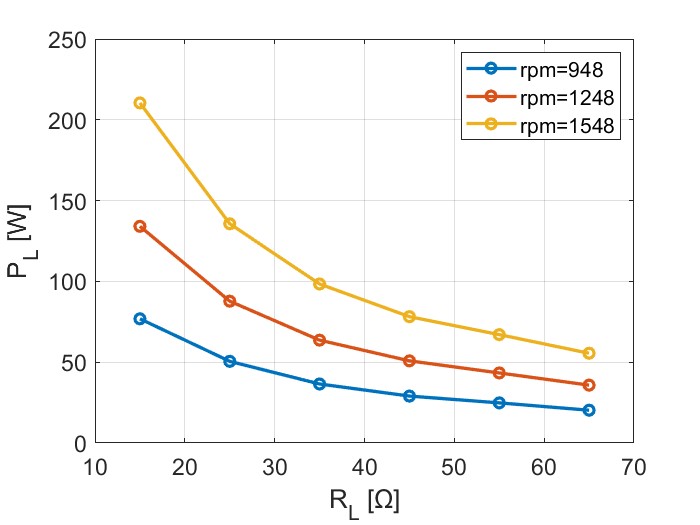
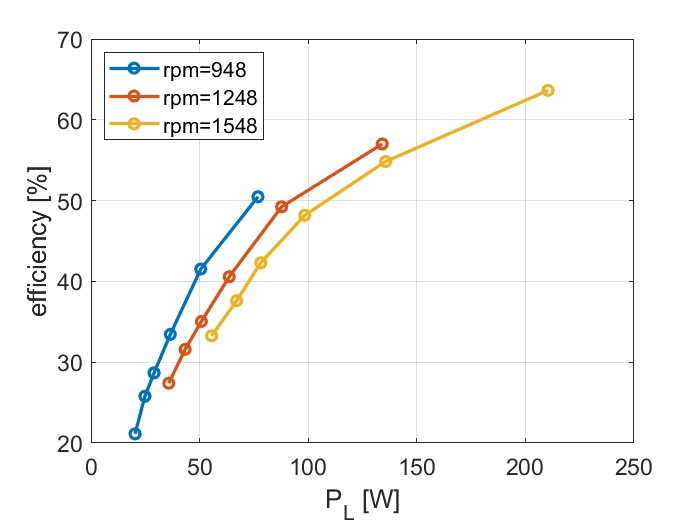
Generator Testing
The assembled generator was tested to evaluate the main electrical quantities and manufacturing quality. The measurements included magnetic flux density, open-circuit phase voltages, load power at different resistances and the resulting generator efficiency.
08
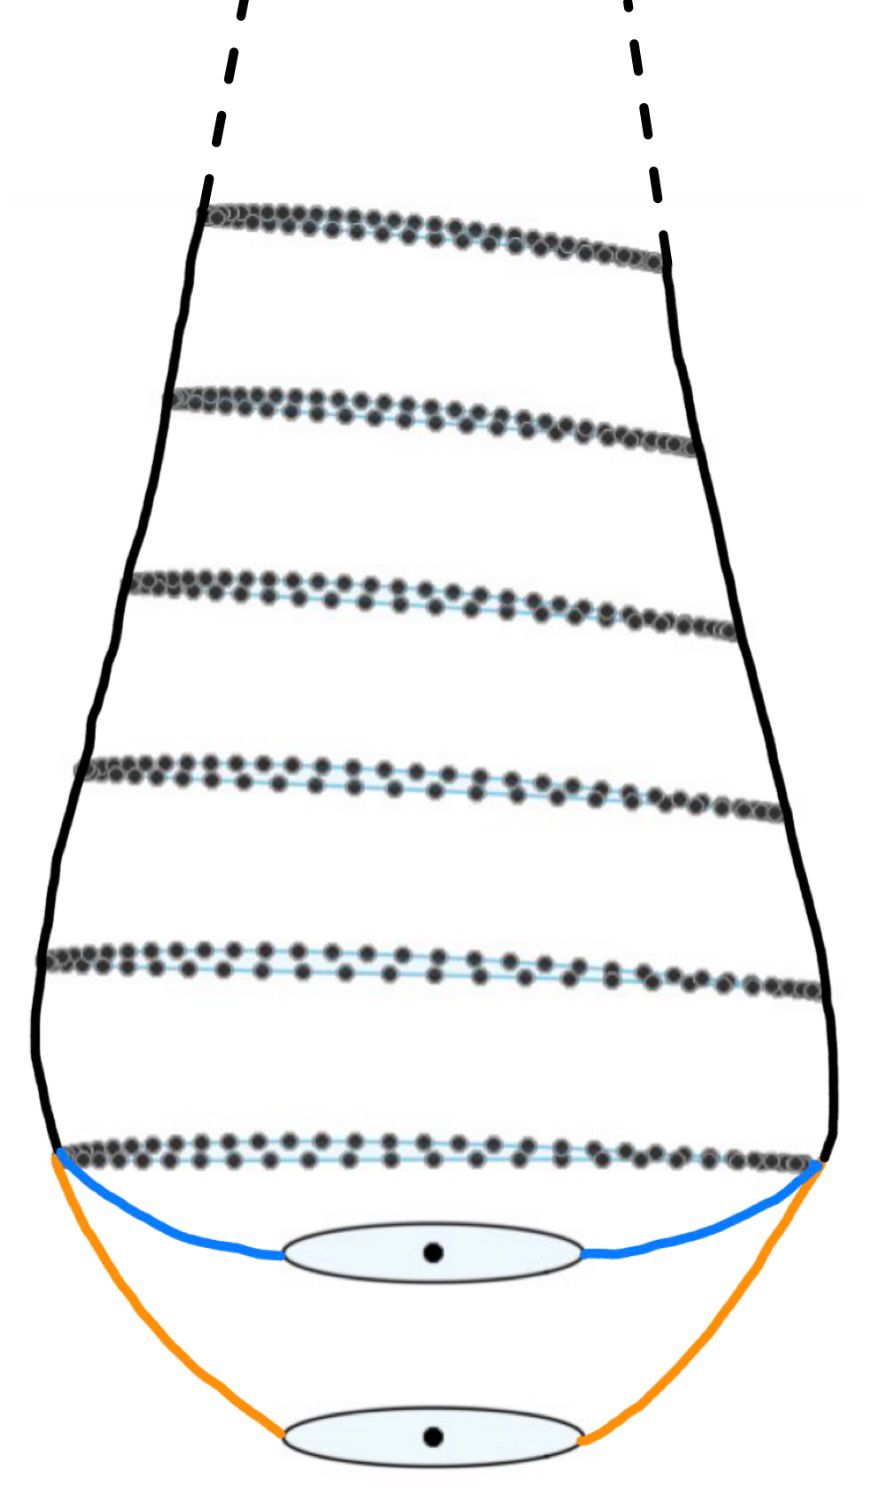
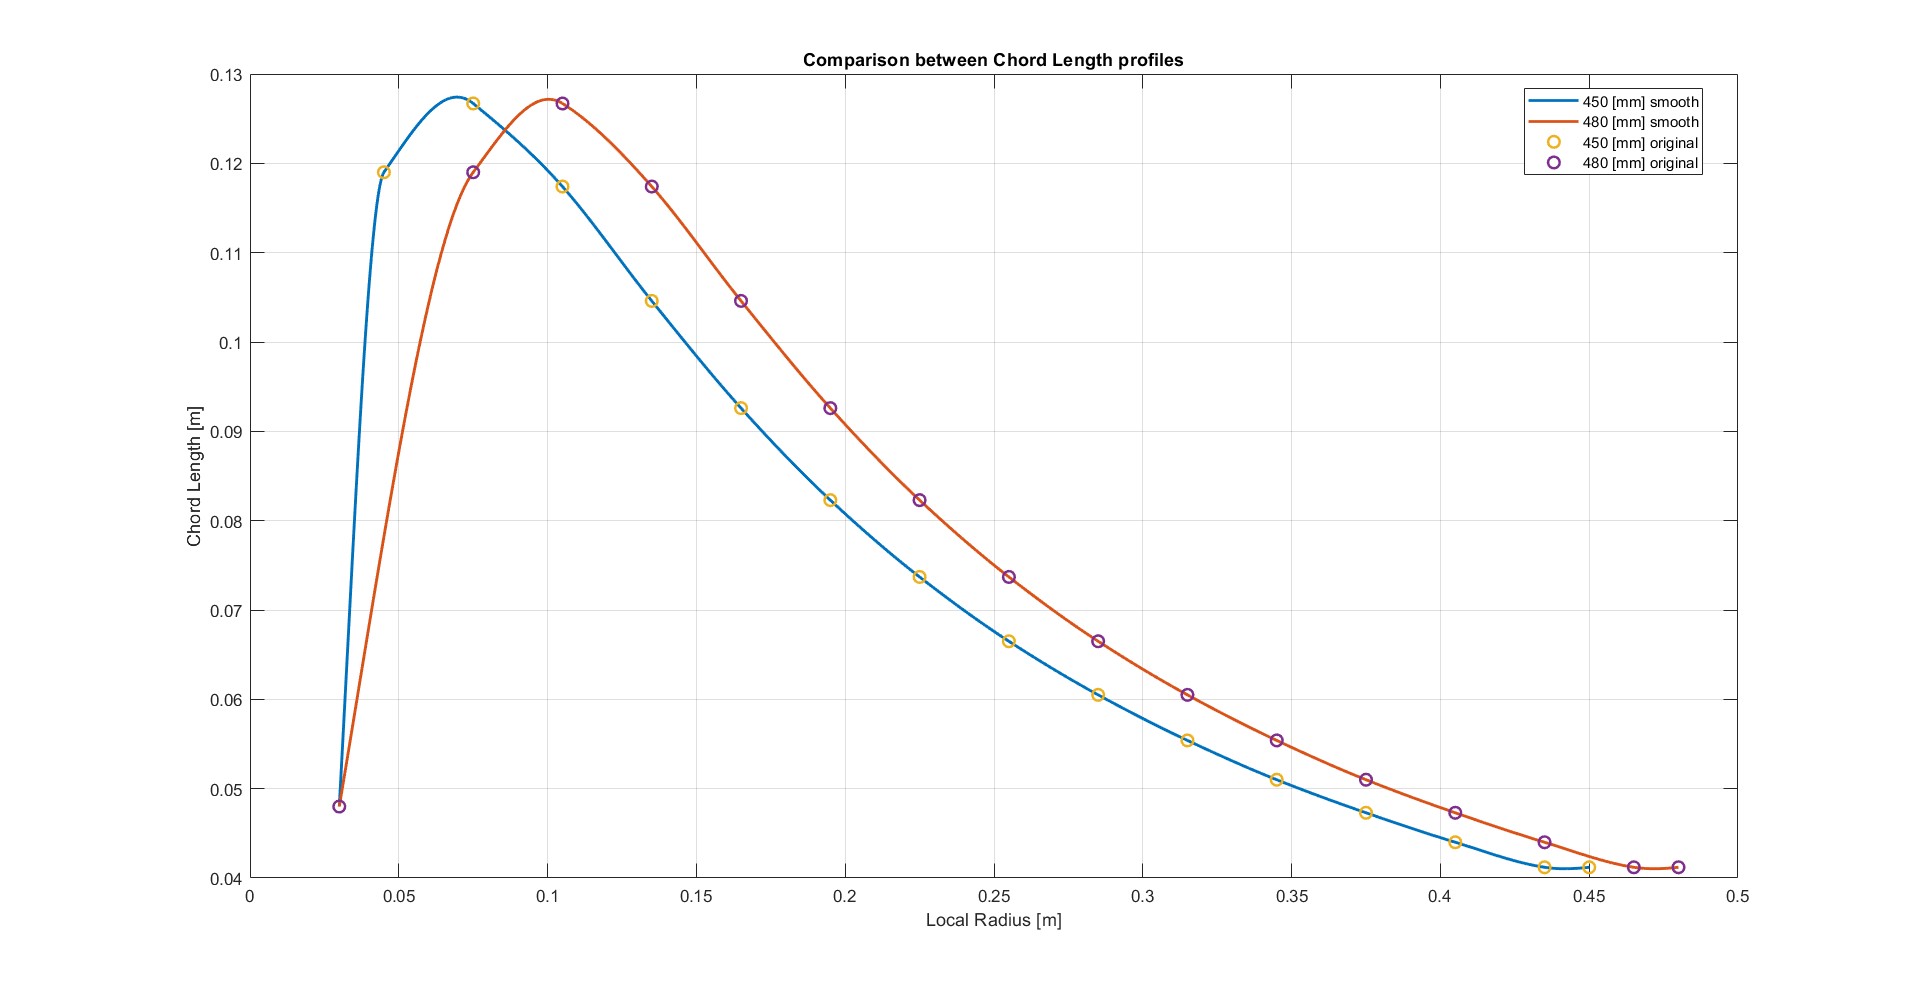
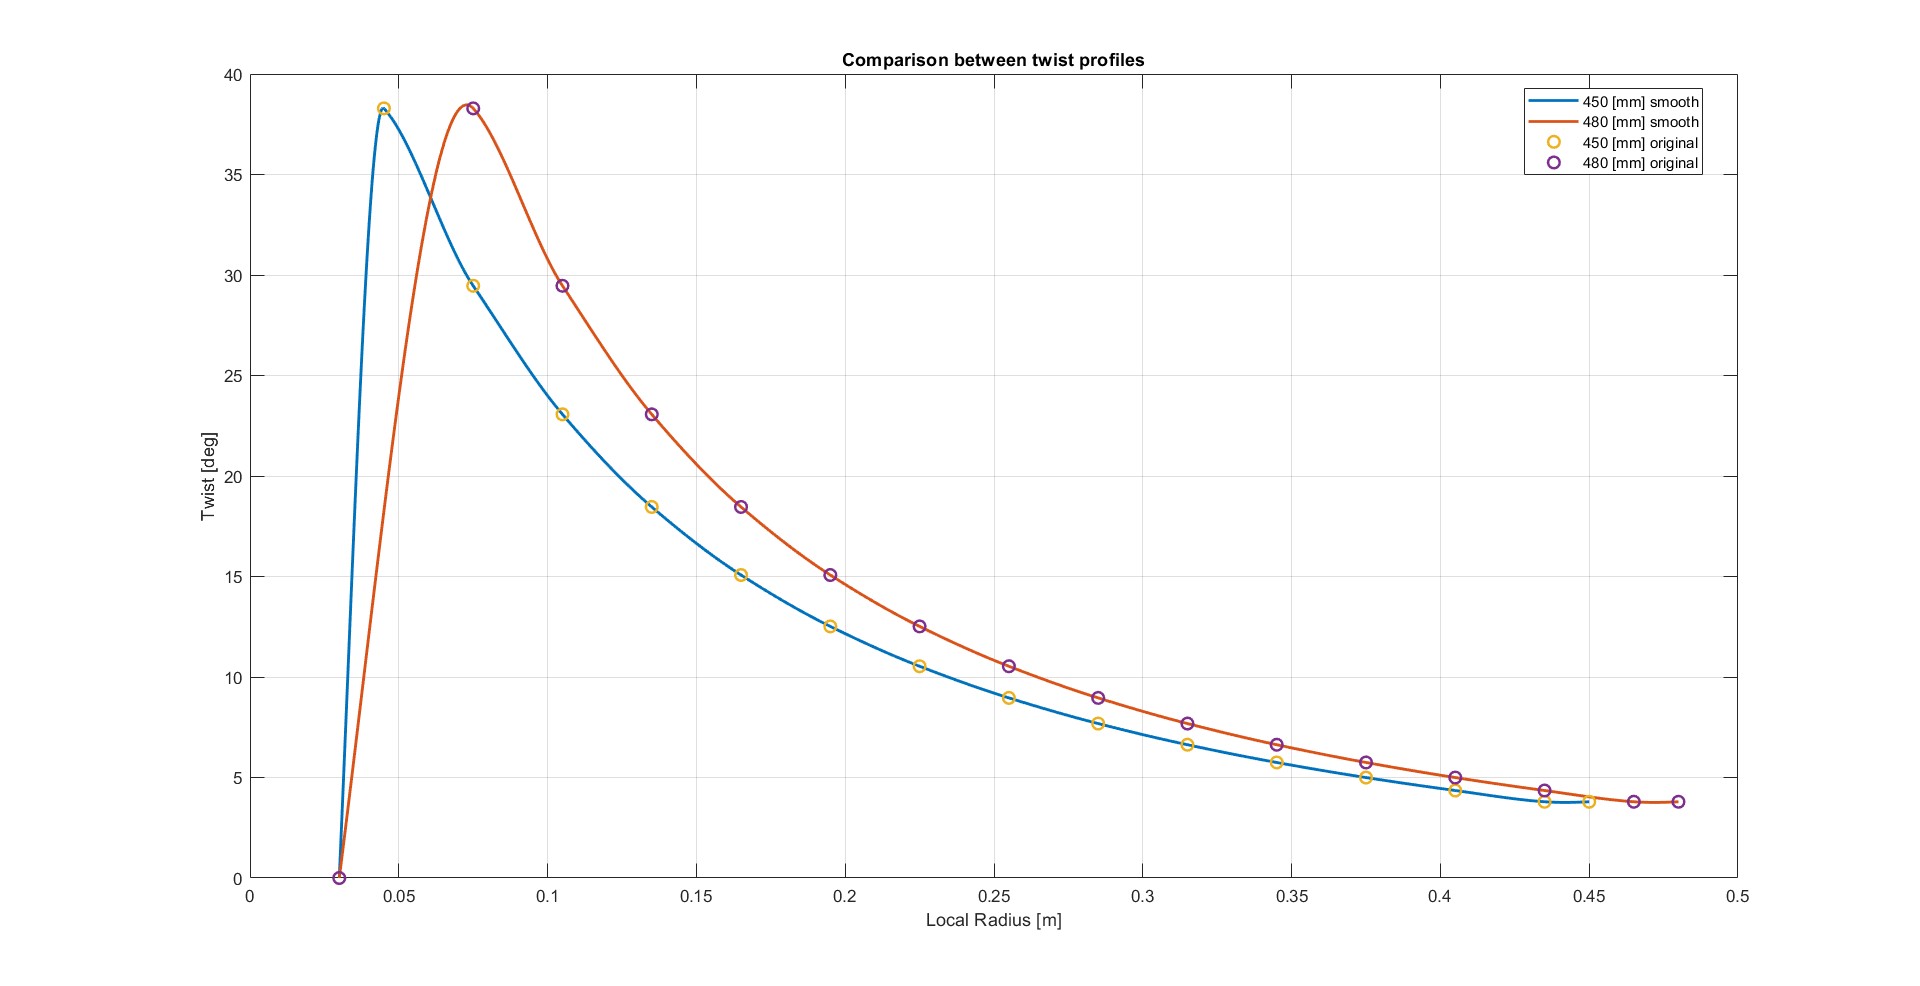
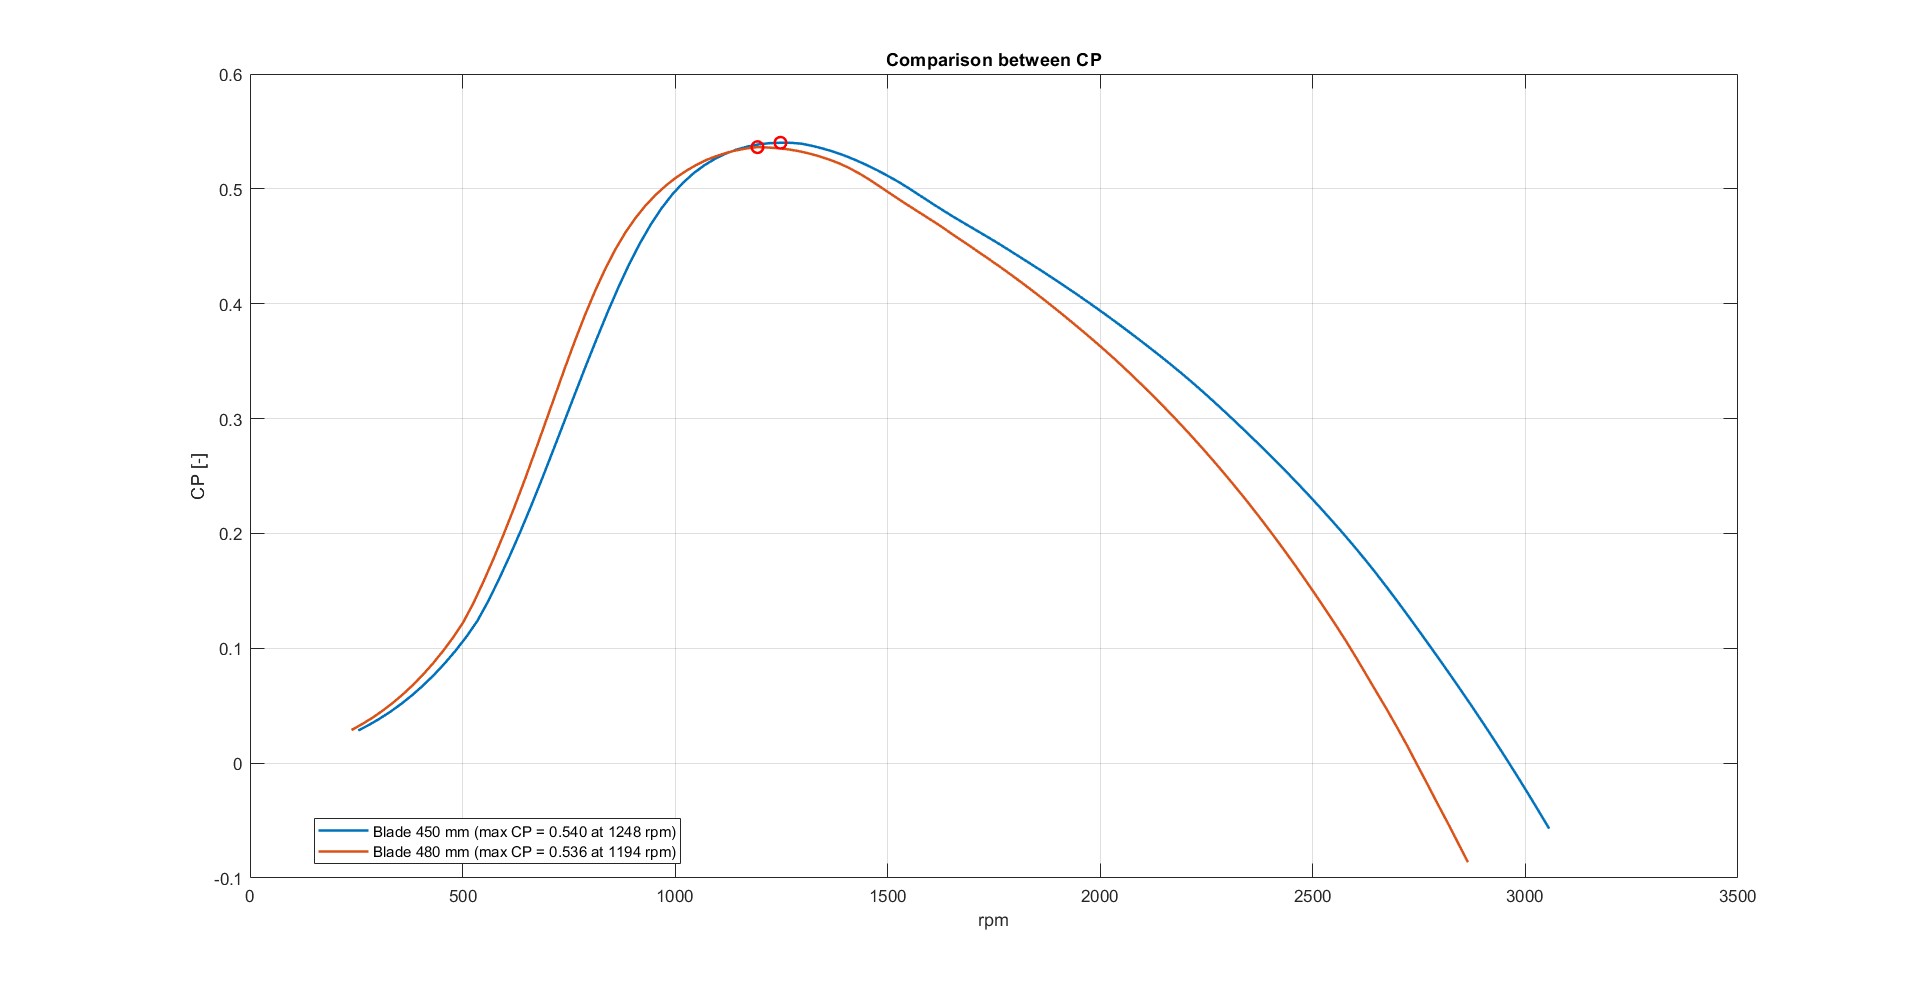
Design Vs Manufactured Blade
During the Fusion 360 implementation, the hub-blade transition was generated with a 45 mm offset instead of the intended 15 mm offset. The manufactured blade therefore became 480 mm long rather than the optimized 450 mm design. Instead of treating this as a simple manufacturing error, the real geometry was reconstructed in QBlade and used to explain the differences between the intended design, the manufactured blade and the later experimental results.
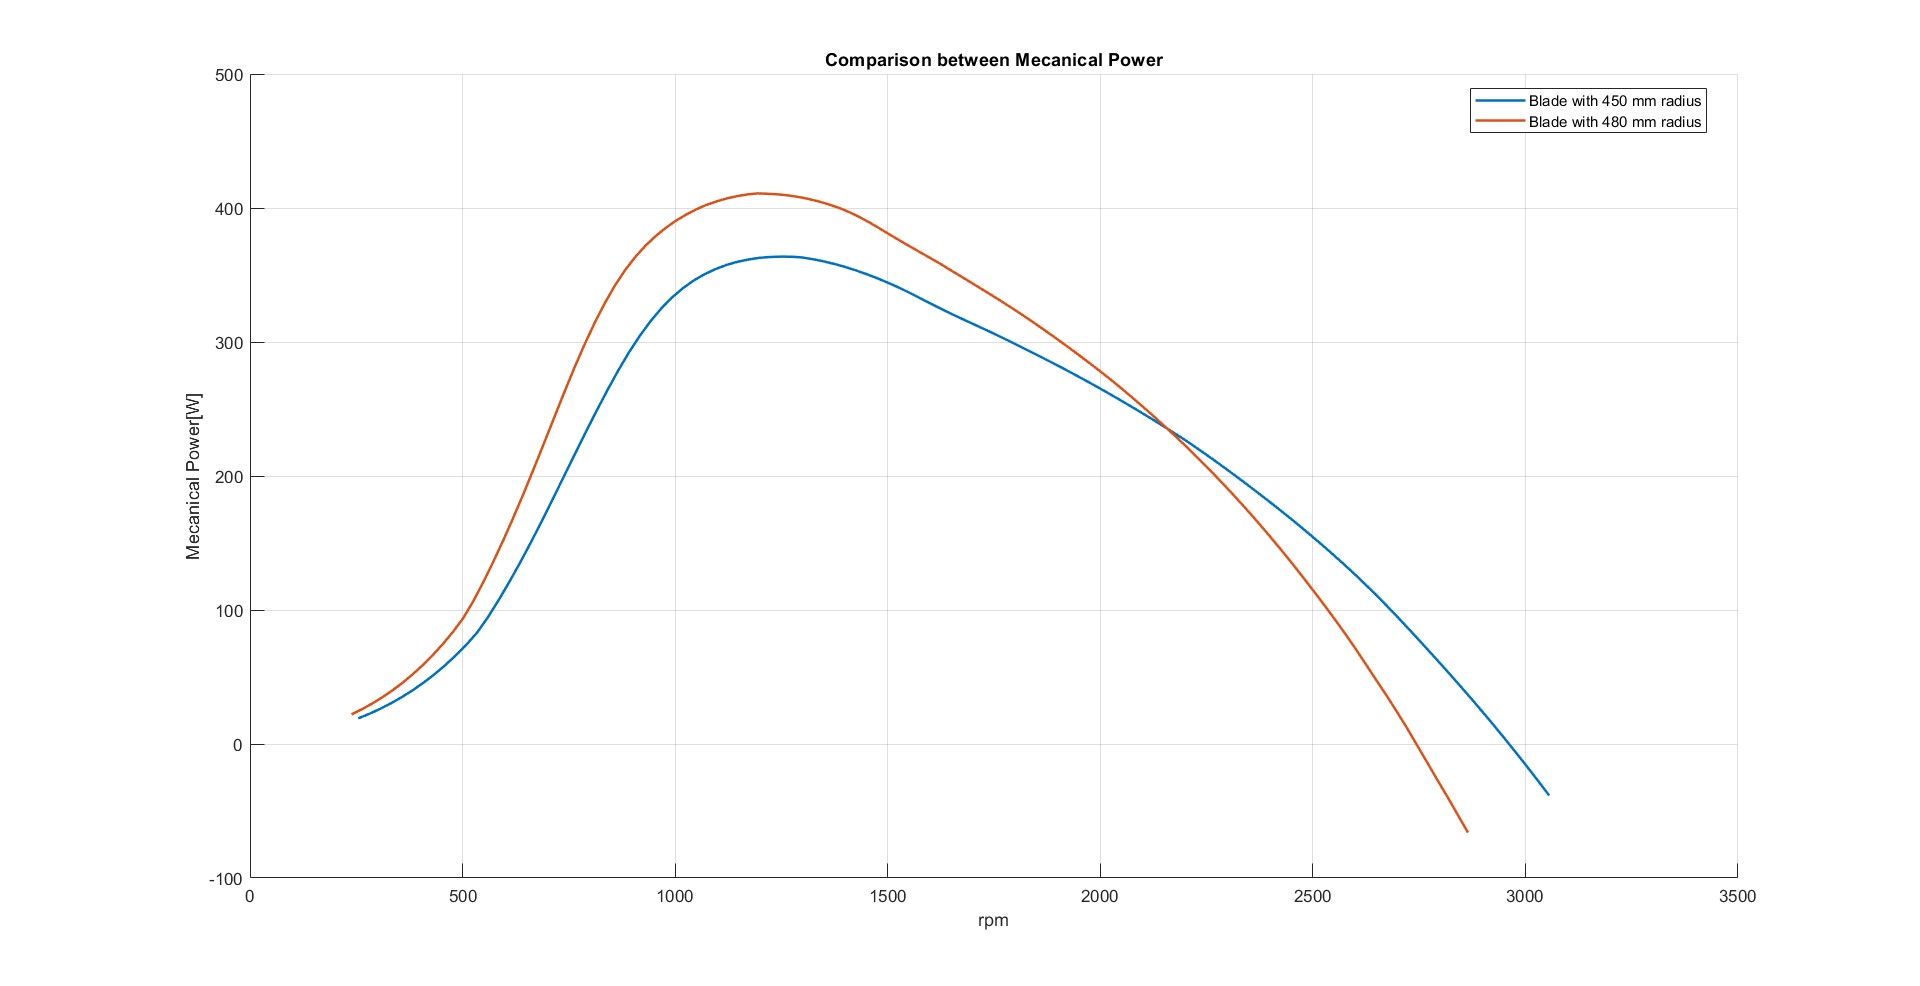
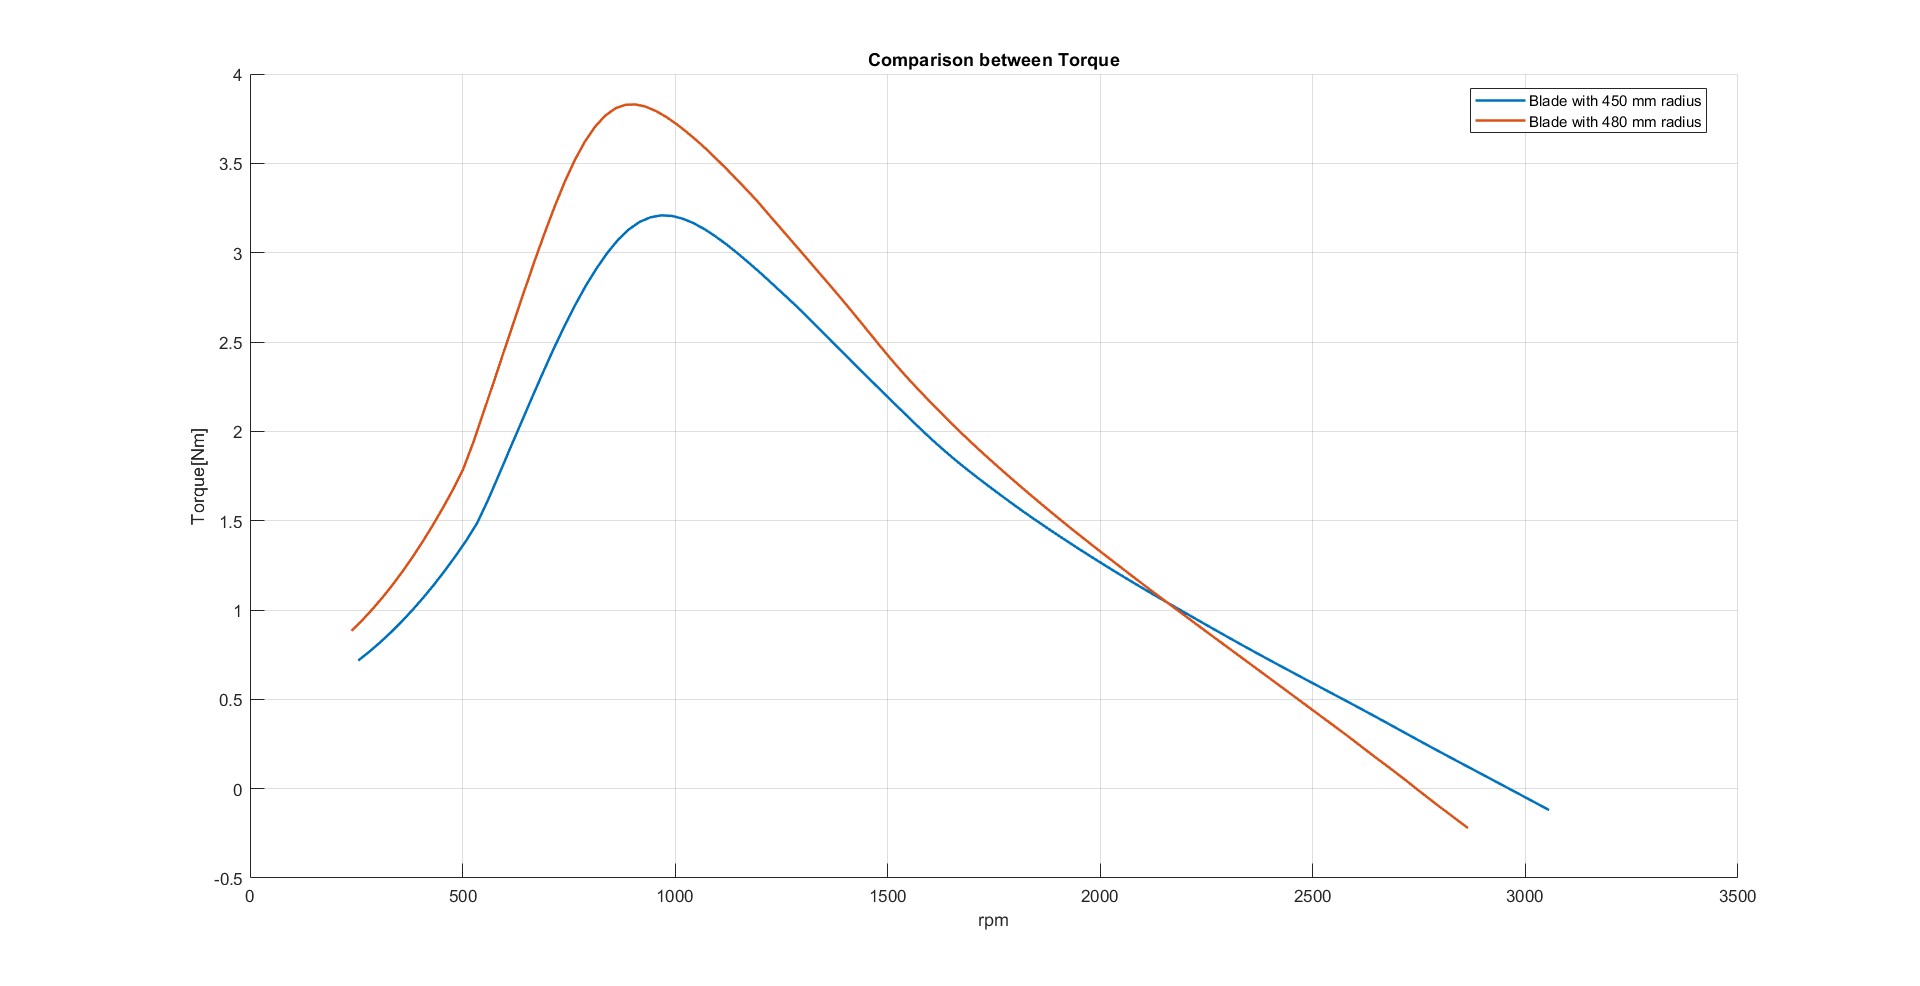
09
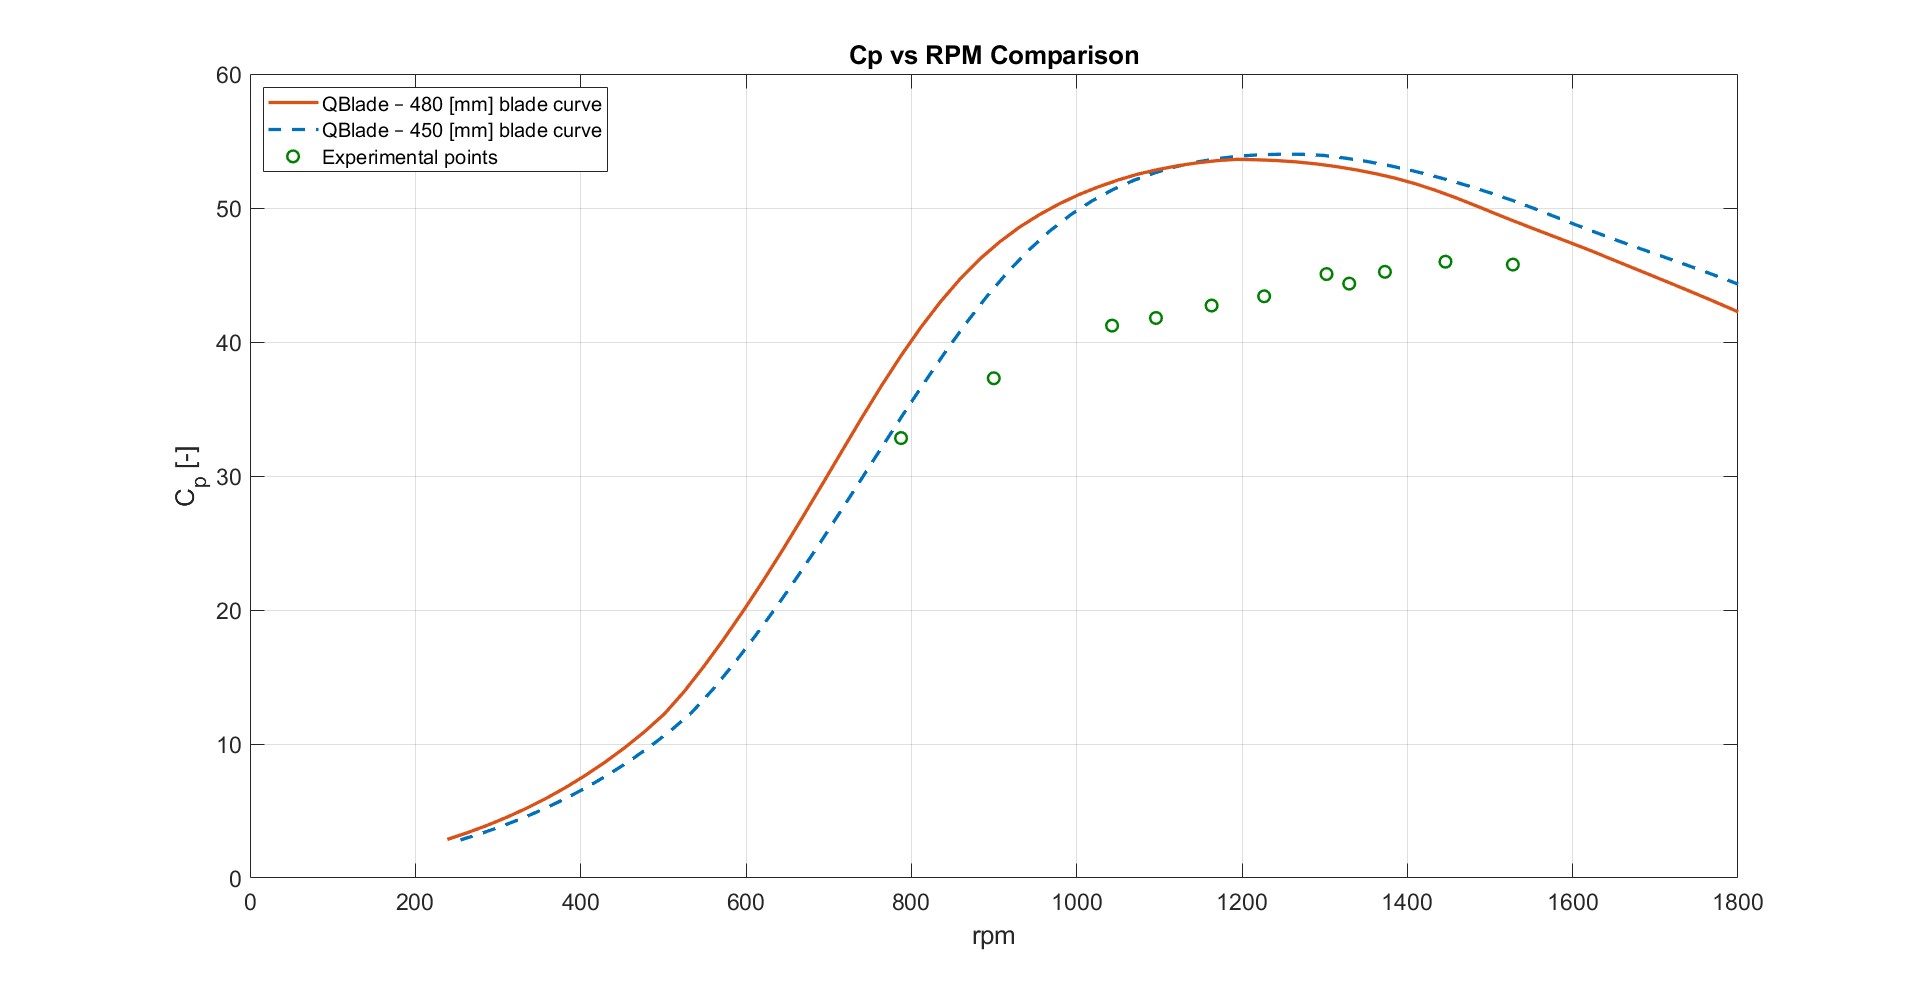
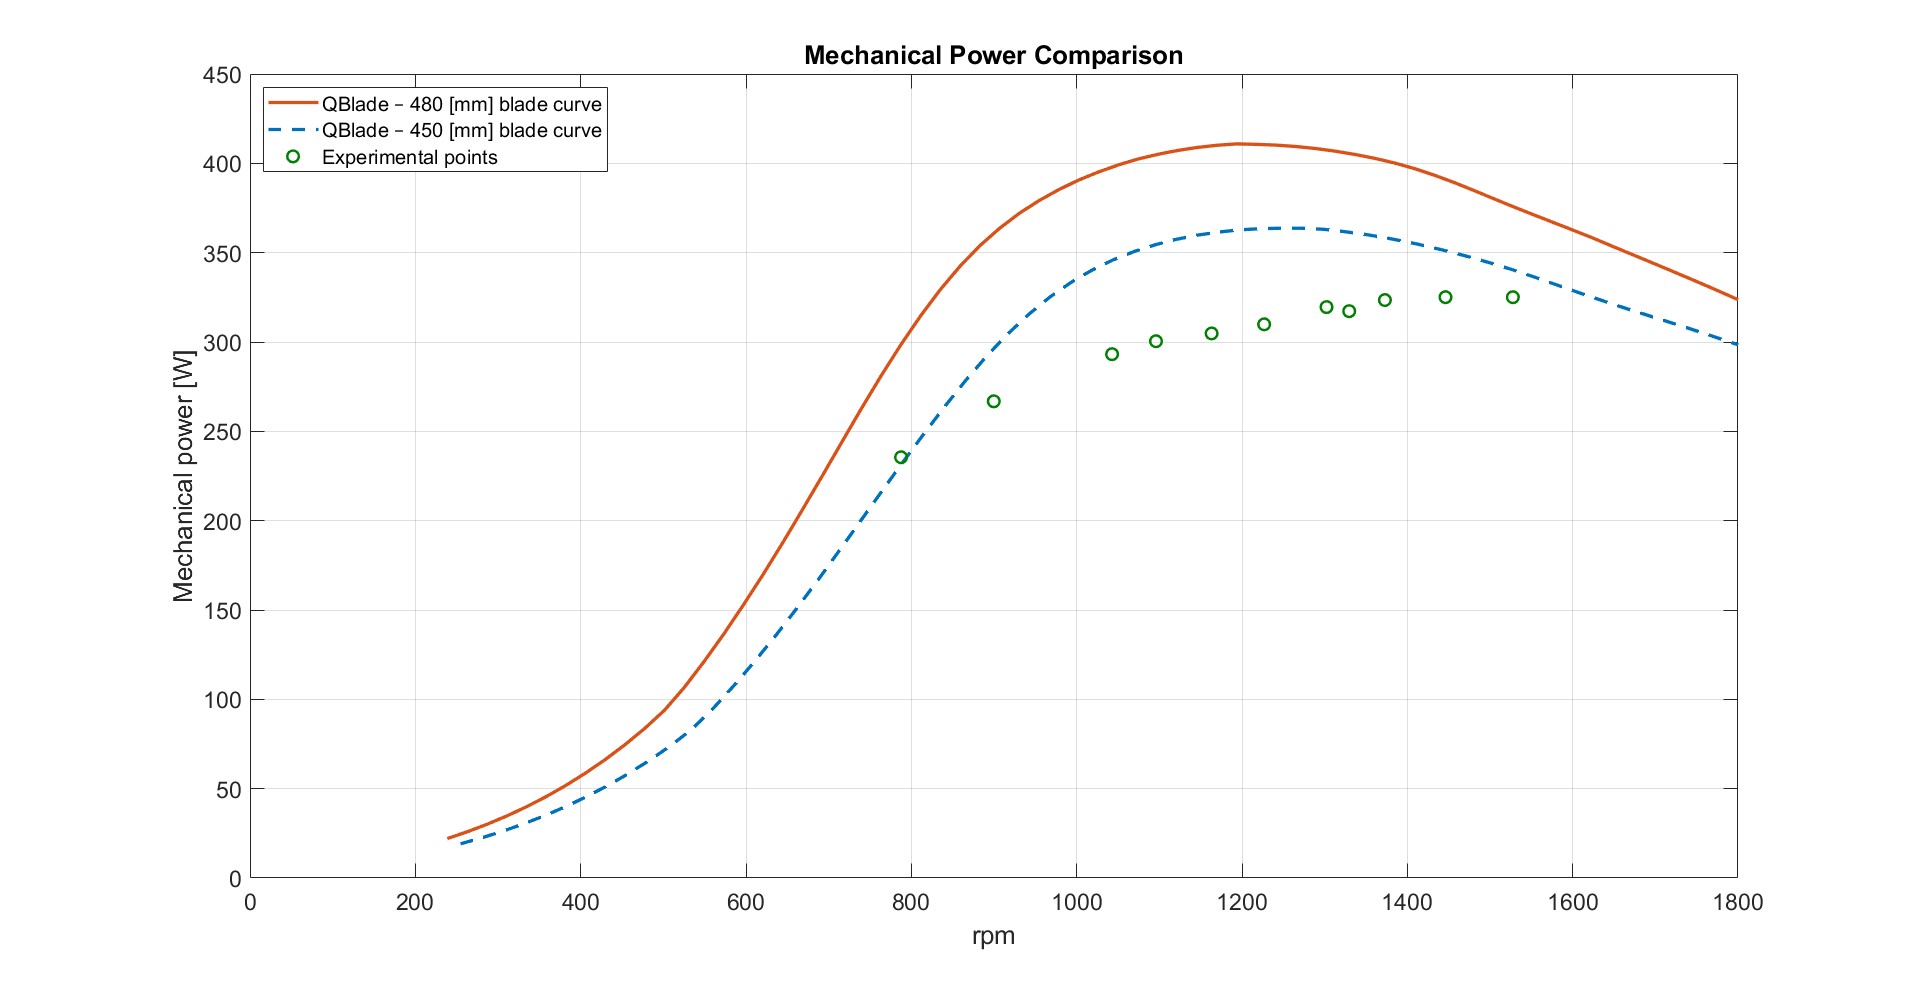
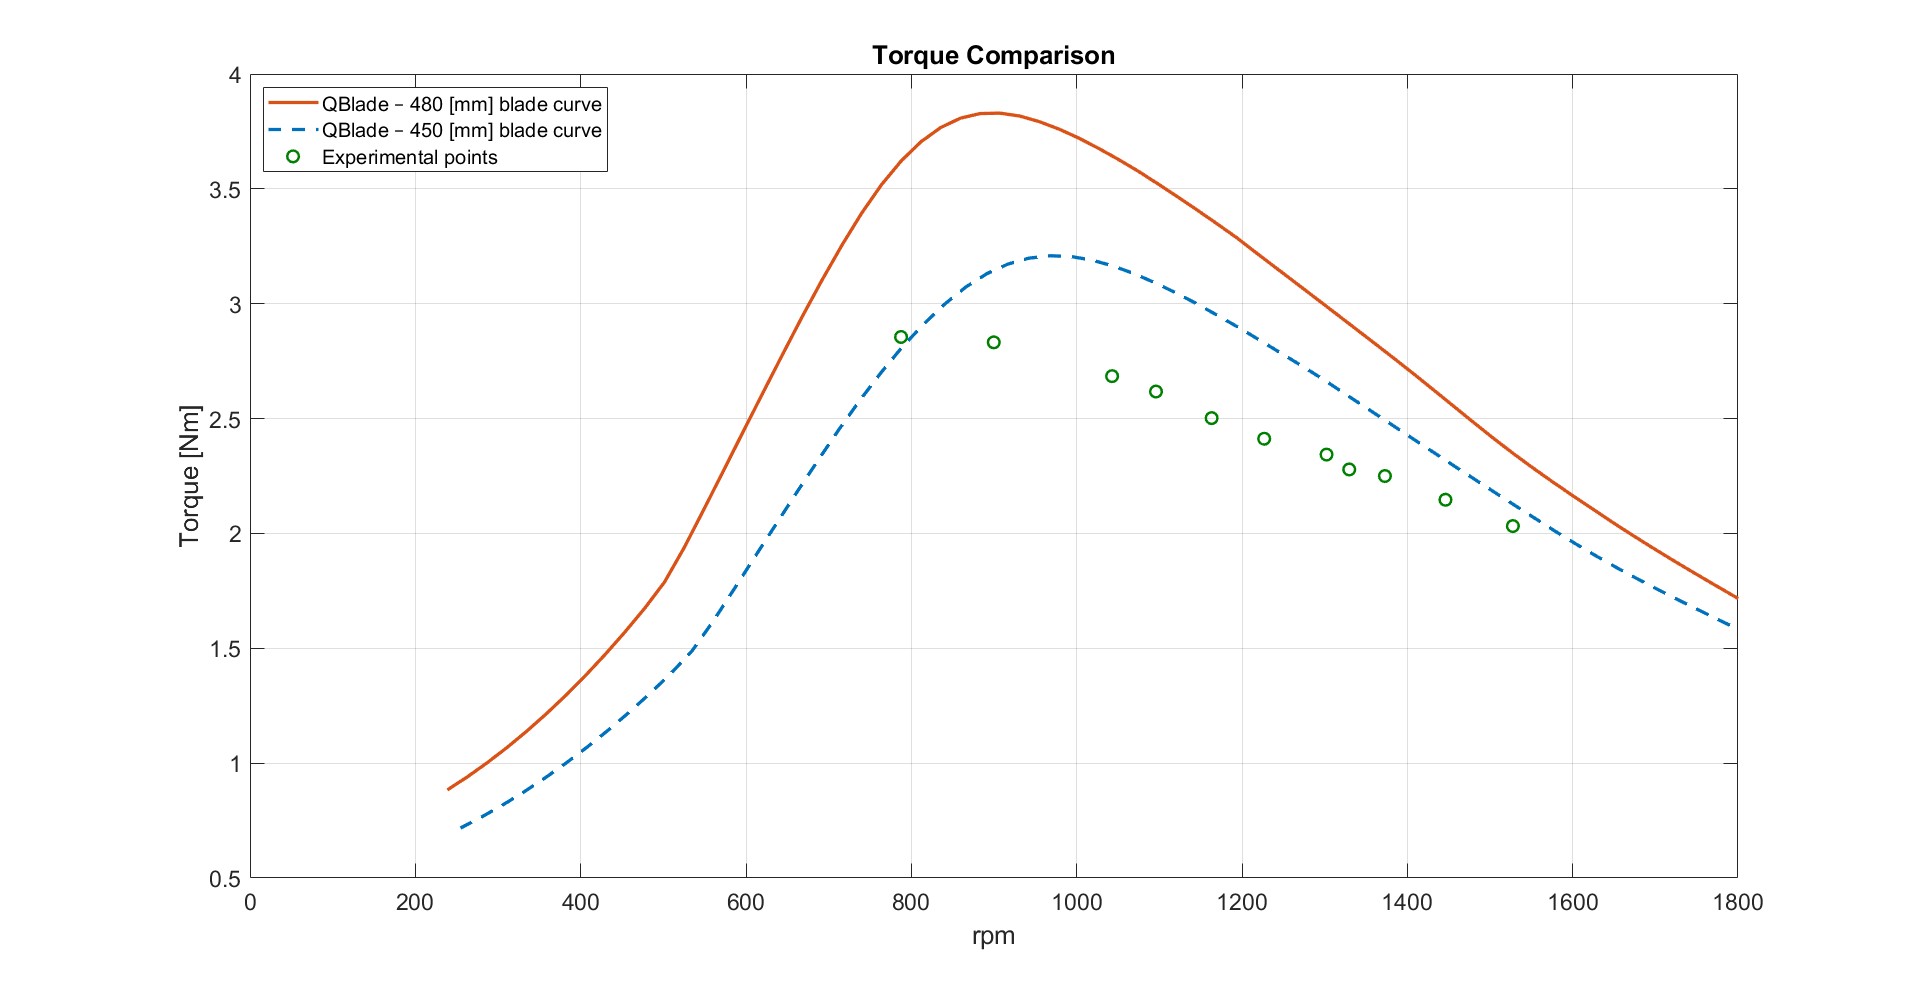
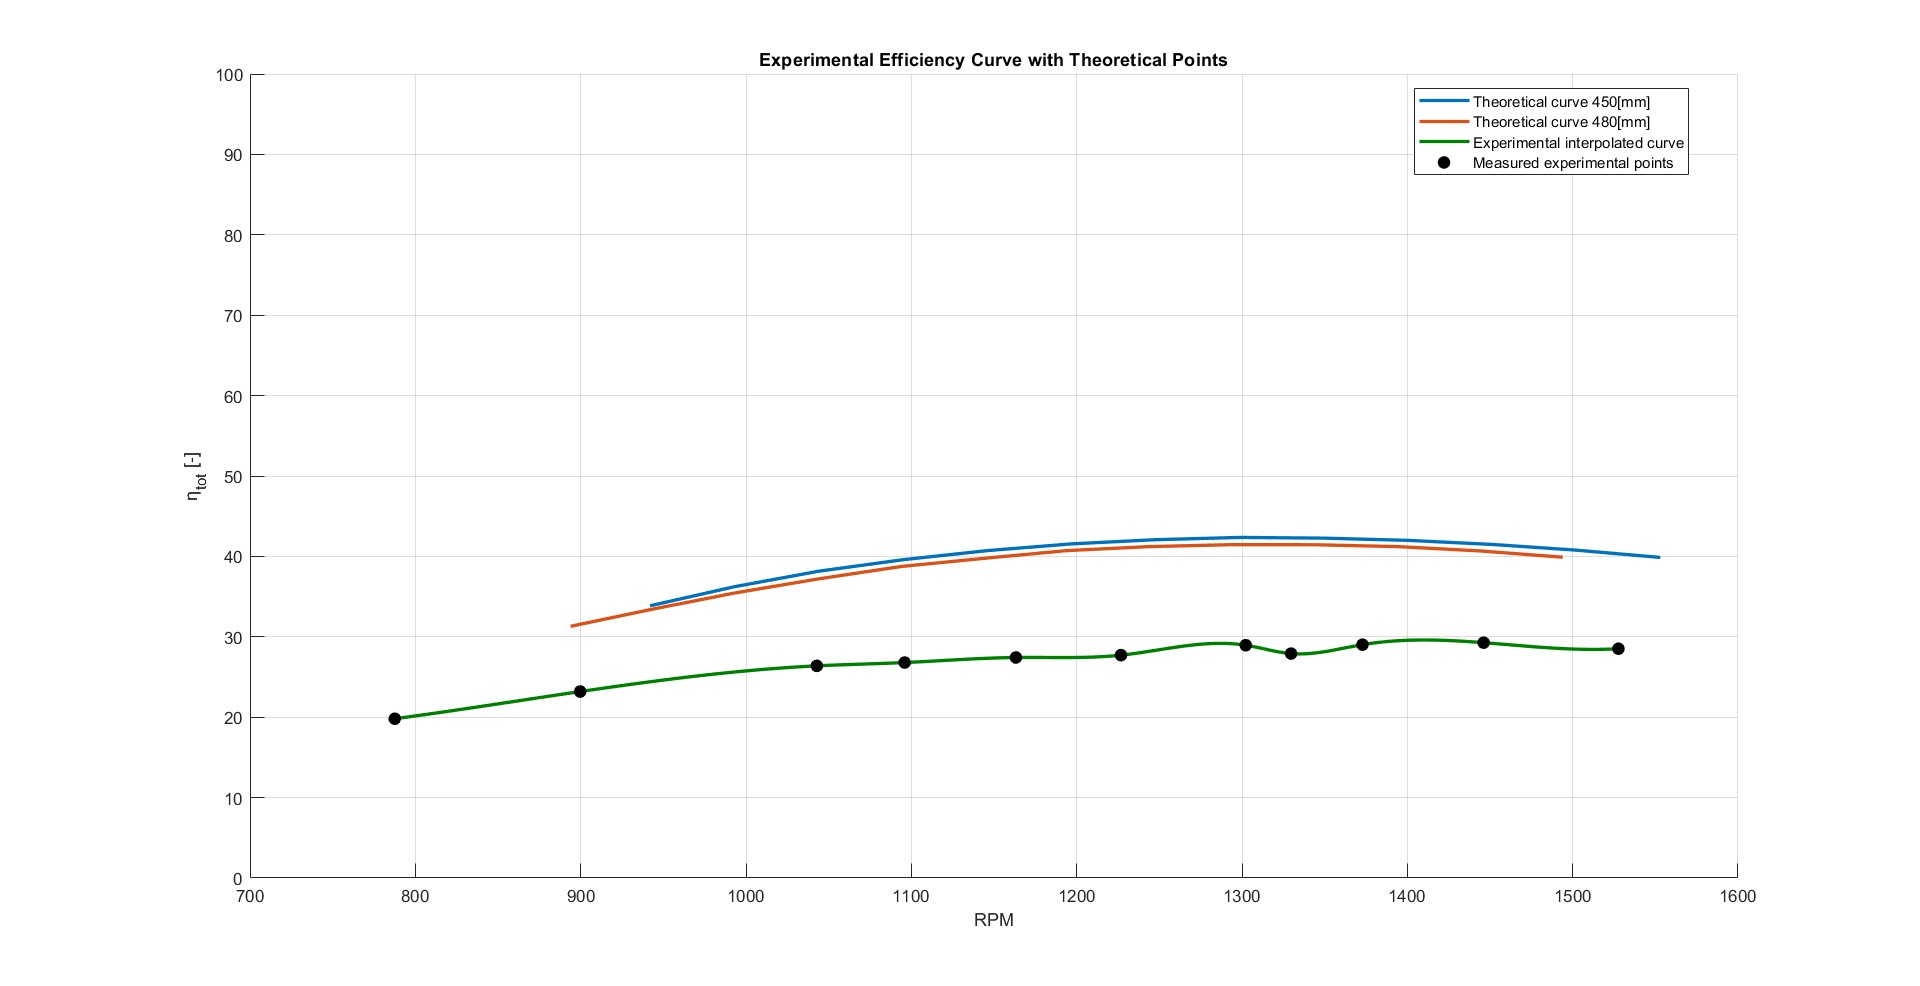
Wind Tunnel Validation
The final prototype was tested in the wind tunnel. Rotational speed, voltage, current and wind speed were measured and used to reconstruct CP, mechanical power, torque and total efficiency. The experimental values were lower than the QBlade predictions but followed the same trends, showing the combined effects of 3D aerodynamics, FDM surface quality, bearing friction and generator losses.